Best Practice Management
Critical Factor Analysis
Data collected during the drip irrigation system performance audit of the Australian almond industry was compared with additional data collected for each valve unit assessed, to carry out critical factor comparison, and identify the key components of best practice management leading to good drip irrigation performance.
Site specific information was compared with Variation in Flow measured at each site. Variation in Flow compares the highest and lowest emitter flow rates measured across the valve unit, and expresses the difference as percentage above and below the midpoint (average of the highest and lowest flows).
This indicator was used as it gave the greatest spread of results, allowing easier comparison across the range of other information collected.
Dripline Age
Variation in flow was compared across the range of dripline installation dates at each site (Figure 1). Pressure compensating systems are shown in blue, and non-pressure compensating systems are shown in orange. The oldest dripline in the sample was installed in 2000, and was therefore 19 years old at the time of testing, and the youngest was newly installed in 2019, thus being less than a year old.
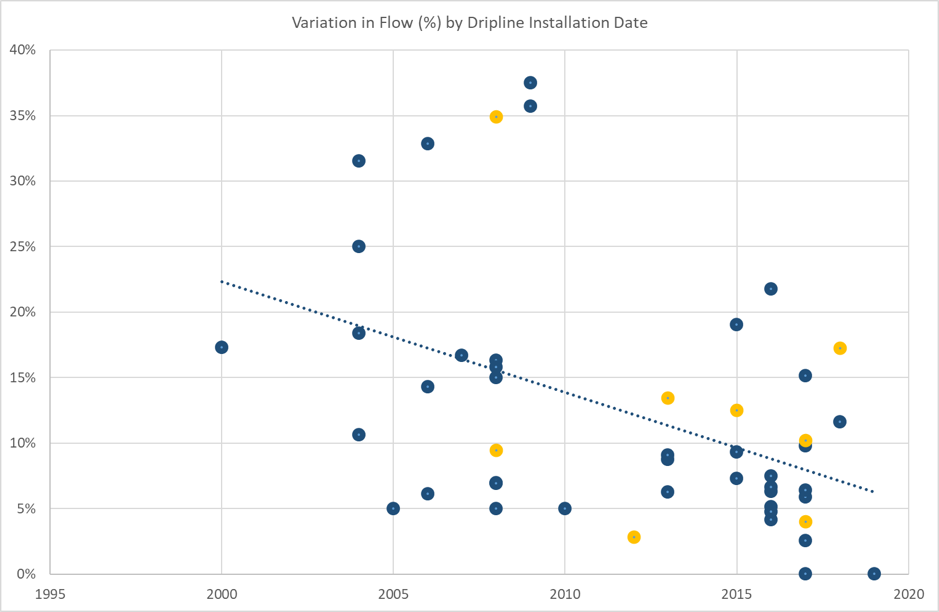 Figure 1 Relationship between variation in flow and installation date of the dripline
Although there is a wide range of performance across the sites measured (from zero to 38% variation in flow), there is a clear trend for older dripline to perform more poorly than newer dripline. Having said that, there are some sites with very new dripline (2 to 4 years old) which are performing poorly (>5% variation in flow), so it is clear that age of the dripline is not the only factor effecting system performance.
There is no indication in the data that pressure compensating systems (blue dots) perform better or worse than non-pressure compensating systems (orange dots) of the same age.
Flushing Frequency
Participating irrigators were asked to indicate how often they flush the dripline laterals in the valve unit being assessed. Figure 2 compares variation in flow with the estimated annual number of lateral flushing events at each site, derived from the flushing frequency data collected.
Flushing is designed to remove the accumulation of debris which comes into the irrigation system from the water source (silt, sand), or in some cases grows or precipitates out in the irrigation system itself (bryozoa, algae). This debris can accumulate in the dripper labyrinth, partially or fully blocking the water passages. Partial blockage may serve to reduce the flow rate of individual drippers, leading to increased variation in flow. However, In the case of pressure compensating drippers, partial blockage may also interfere with the operation of the pressure compensating diaphragm, resulting in increased flow from affected drippers.
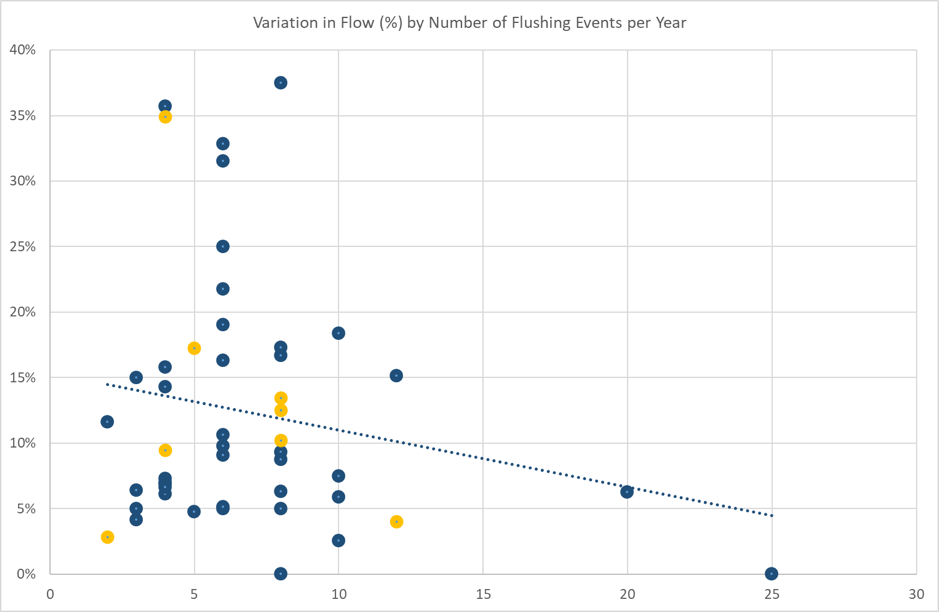 Figure 2 Relationship between variation in flow and number of flushing events per year
There is likely to be a degree of error in the calculation of the number of flushing events per year, but there is a clear trend in the above graph for better performance (lower variation in flow) with an increase in flushing events. However, it is clear that there is a wide range in performance with the same flushing frequency in the data below 10 flushes per year, and it is the performance of the two sites where flushing occurs 20 and 25 times per year that are particularly influencing the trend line.
This suggests two conclusions:
- The source and condition of the water used, along with the suitability of the filtration system, has a large influence on how much debris enters and settles out in the laterals, and it is the amount and type of this debris which determines how often flushing is required;
- In general the amount of flushing across the almond industry is possibly insufficient, and more frequent flushing will assist in improving system performance.
Chemical Dosing Frequency
In addition to flushing, chemical dosing of the irrigation system, including the dripline laterals, can assist in clearing debris from the irrigation system, which should result in less variation in flow rate between drippers.
The type of chemicals used depends very much on the make-up of the water being used, and the presence of biological factors within the system. We did not attempt to evaluate the type of chemicals used, but rather looked at the frequency with which chemical dosing was applied.
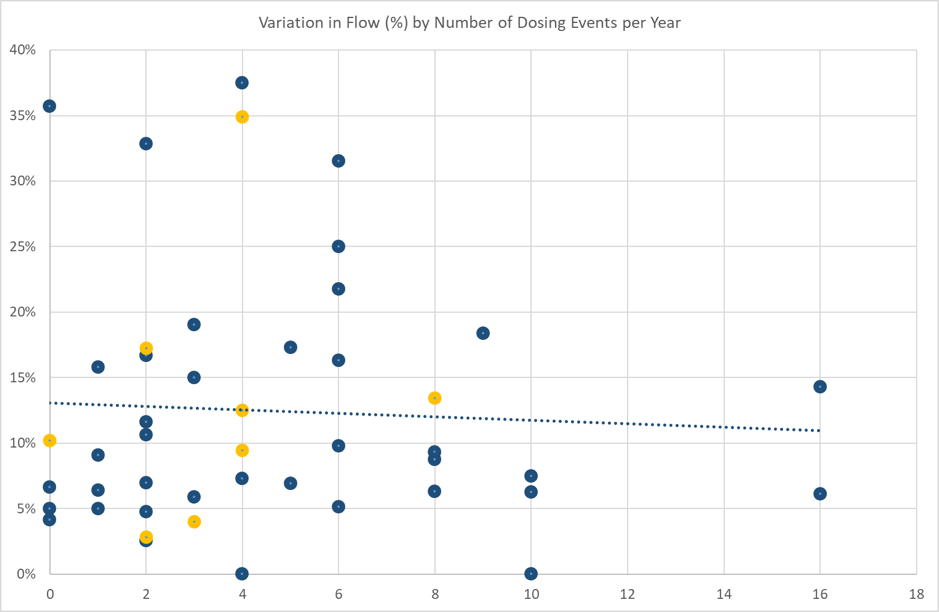 Figure 3 Relationship between variation in flow and number of chemical dosing events per year
The graph and trend line in Figure 3 indicate that the effect of dosing frequency is much weaker than the effect of flushing frequency (Figure 2), with a much flatter slope to the trend line. Despite this, there are likely to be specific sites where chemical dosing is critical, due to the characteristics of the water, for example where there is calcium carbonate or iron in ground water, which precipitates out of solution when exposed to air at the dripper outlet. Chemical dosing is the only way to combat this issue.
However, in the majority of the sites tested, and across the Australian almond industry in general, water quality issues are more related to suspended matter and biological growth within the irrigation system. Chemical dosing is important to manage biological activity in the system, but frequent flushing is the best way to manage both of these issues, by clearing material from the system before it is able to accumulate and begin to block emitters.
This does not mean that chemical dosing is unnecessary, but the frequency and type of dosing is much more dependent on the types and concentrations of material in the water and irrigation system, and must therefore be managed on a site specific basis.
Location of Orchard
The relationship between irrigation system performance and where the orchard is located. This graph is a box and whisker plot, where the large box contains the middle 50% of data points, the whiskers contain the majority of the remaining data, and outliers are shown as isolated dots beyond the whiskers.
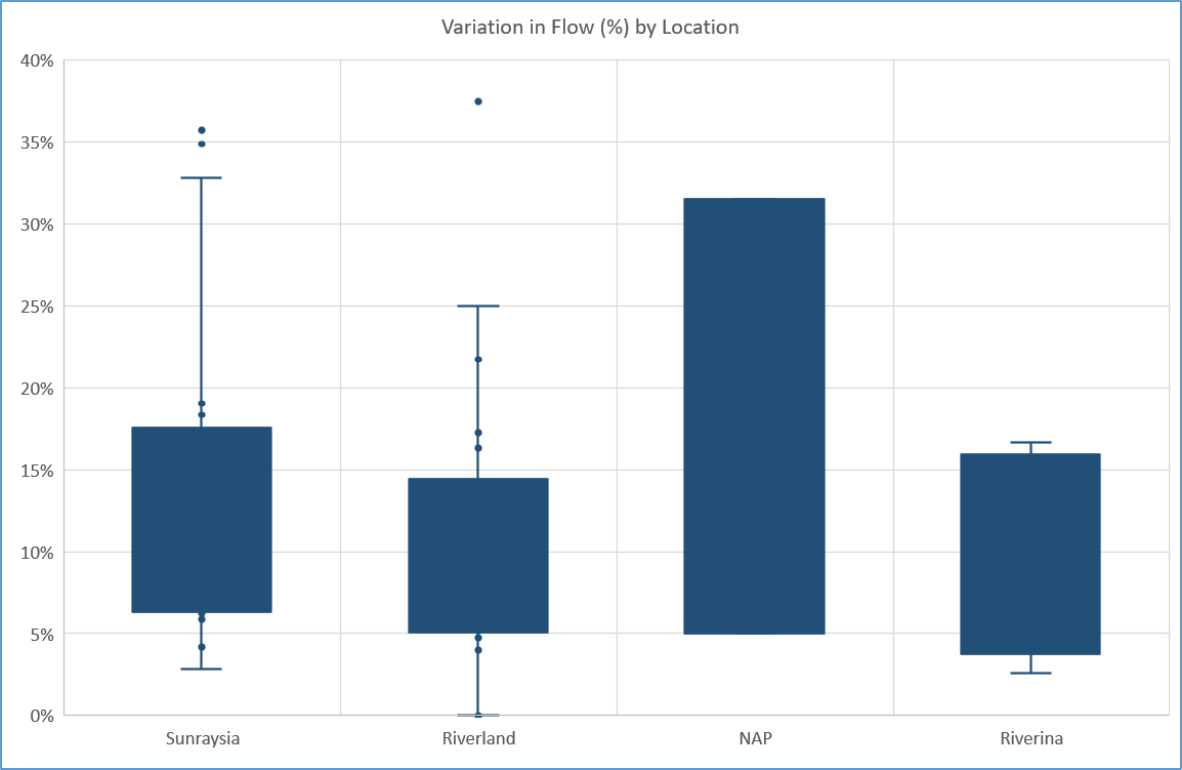 Figure 4 Relationship between variation in flow and the location of the orchard
There is little difference in data between the regions. The bar for Northern Adelaide Plains (NAP) contains only two data points, one with very low variation and the other with quite high variation. Note that the sites with the highest variation (poorest performance) are distributed across Sunraysia, the Riverland and the NAP. It is likely that sites with high variation are present in the Riverina, but the small number of sites tested in that region limited the opportunity to identify them.
Pressure Compensation
Figure 5 displays the range of values for variation in flow for valve units with pressure compensating dripline (Y) and non-pressure compensating dripline (N).
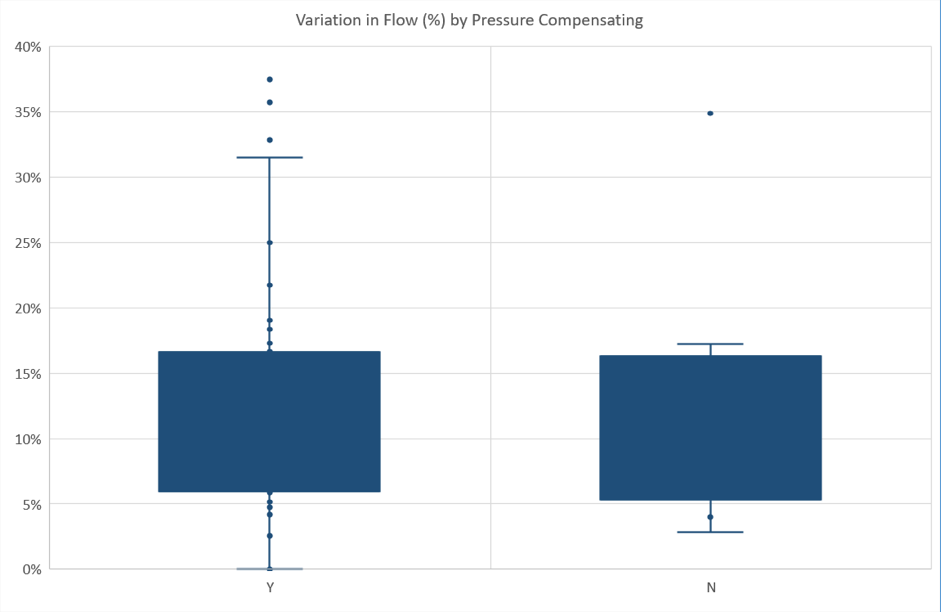 Figure 5 Relationship between variation in flow and pressure compensation
The graph indicates that there is little difference in performance between pressure compensating and non-compensating dripline in the middle range of the data (box), and in the worst performing sites. However, in both cases 75% of sites (the box representing the middle 50% plus the highest 25%) have variation in flow greater than the standard (<±5%).
Water Source
The properties where the valve units assessed are located draw water from a number of sources. The River Murray is the major primary source, but for many of the properties the water originating in the river is drawn from a secondary source, which influences the characteristics of the water. These secondary sources include pipelines (for example irrigation trusts), dams, creeks, lakes and channels. A few properties draw water from bores.
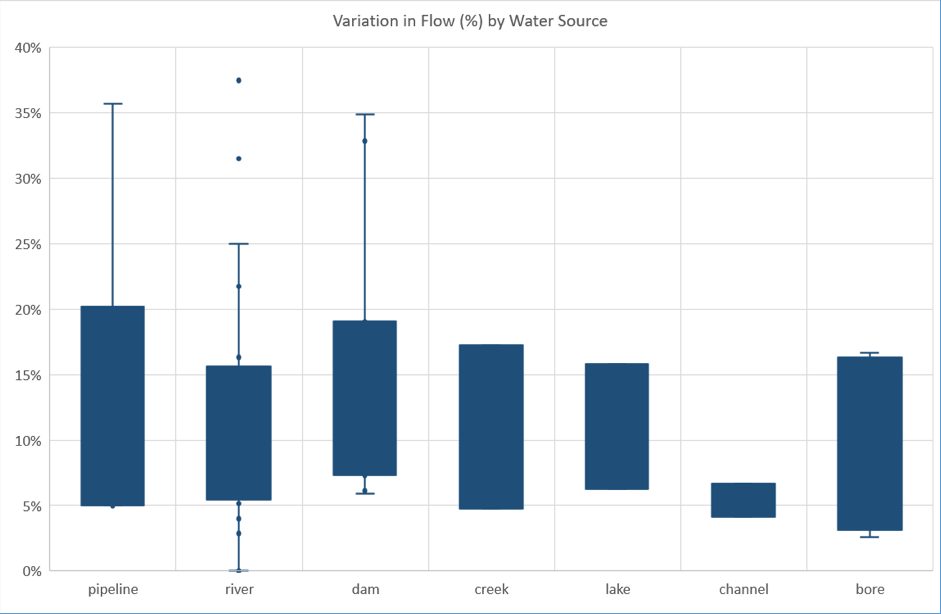 Figure 6 Relationship between variation in flow and water source
The performance of the systems varied a little depending on the water source (Figure 6), with a few clear trends. Water drawn from a channel showed the best performance, with a maximum variation in flow of 7%. However, this represents only three sites, so this is not clear evidence that channel water supply is superior to other water sources. At the other end of the scale, the worst performing sites drew water either direct from the river, or via a pipeline system or dam. Again, the number of sites represented by these high values is small, and therefore it is not clear that these water sources are inherently more problematic than others.
Filter Type
Data was collected from each property on the type of filtration used, both as the main filtration for the property, and as check filters at the valve unit. Filter type included both the form of filtration used (screen, disc or sand), and whether the filters flush automatically or must be manually flushed.
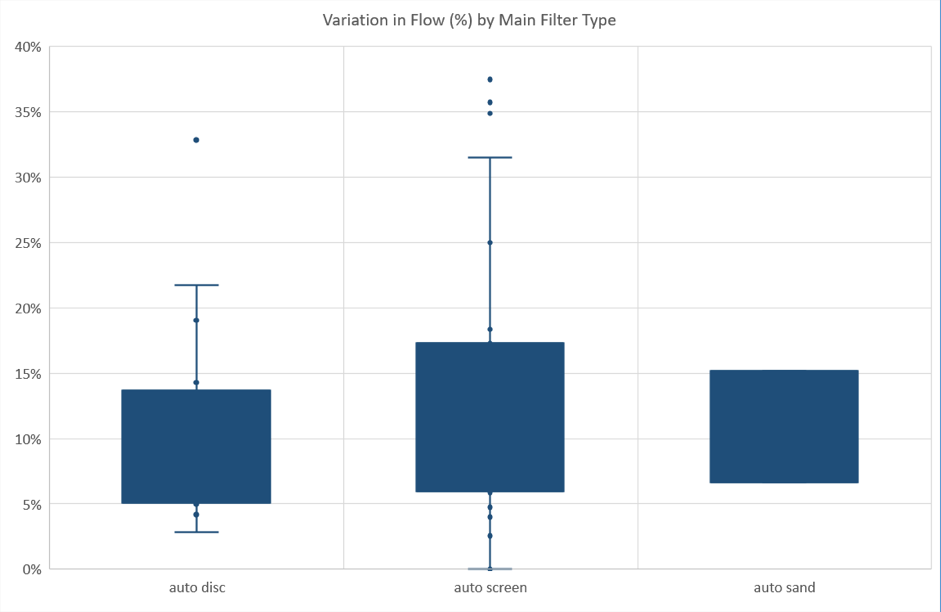 Figure 7 Relationship between variation in flow and main filter type
Data for the main filters at the property (Figure 7) shows that all properties utilise automatic flushing on their main filters. The performance of the different types of filters are similar, although sand filters did not show any sites with very high variation in flow, but this group only includes two sites, so is far from definitive.
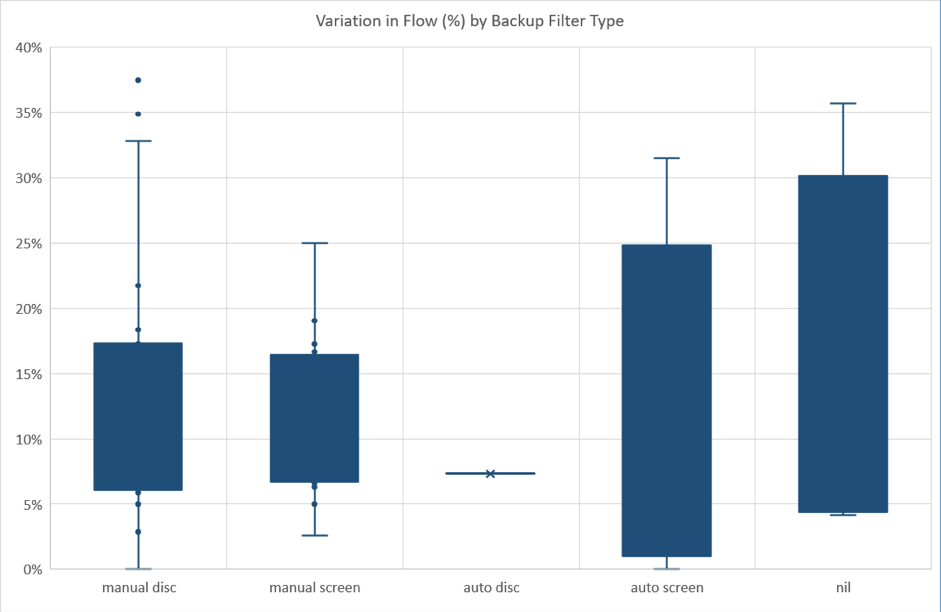 Figure 8 Relationship between variation in flow and backup filter type
Data for backup filters (Figure 8) shows a range of filter types, including both automatic and manual flush versions of screen and disc filters, as well as a significant group with no backup filtration at all. The performance of the sites with no backup filtration is not significantly worse than the other groupings, perhaps reflecting that these sites had fewer problems with water quality, and therefore could get away without backup filtration. However, backup filtration is strongly recommended for drip irrigation systems.
Flushing Manifolds
The use of flushing manifolds is common across drip irrigated almonds in Australia. This involves linking a number of laterals together with a manifold at the downstream end, so that the whole group of laterals are flushed by opening a single tap on the manifold, rather than opening the ends of each lateral. This is much more efficient in terms of time commitment, but some growers have raised questions about the effectiveness of flushing manifolds in clearing debris from all laterals equally.
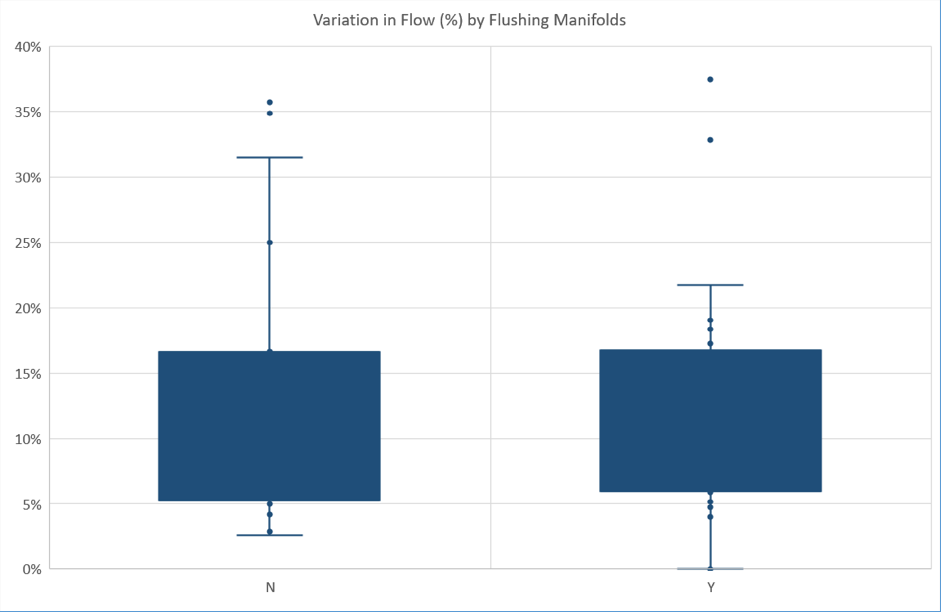 Figure 9 Relationship between variation in flow and the use of flushing manifolds
The data (Figure 9) suggests that there is no relationship between the presence or absence of flushing manifolds and performance of the irrigation system. The range of performance is remarkably similar across both groups (with and without flushing manifolds).
This does not necessarily indicate that flushing is as effective using flushing manifolds as it is when opening individual laterals. Analysis of the data indicates that the average number of flushes per year for systems using flushing manifolds is 8.25, whilst the average annual flushes for systems without flushing manifolds is 4.9, or only 59% as many. This reflects the ease of flushing with manifolds compared to flushing individual laterals.
Given that the frequency of flushing is a key indicator of good system performance (Figure 2), the fact that systems without flushing manifolds performed similarly to systems with flushing manifolds, but with far lower frequency of flushing, suggests that the effectiveness of flushing may be superior in the systems without manifolds. This is a topic which would benefit from further investigation.
Colour of Flush Water
During the onsite evaluations, a lateral or flushing manifold was opened, and the colour of the flush water was assessed to determine the amount of debris in the system. This was carried out at most sites, although some sites were not assessed.
The purpose of this assessment was to determine how dirty the system was at the time of the evaluation. In some cases the grower flushed the system immediately before the evaluation, but at many sites this was not the case, and the condition of the system reflected normal conditions.
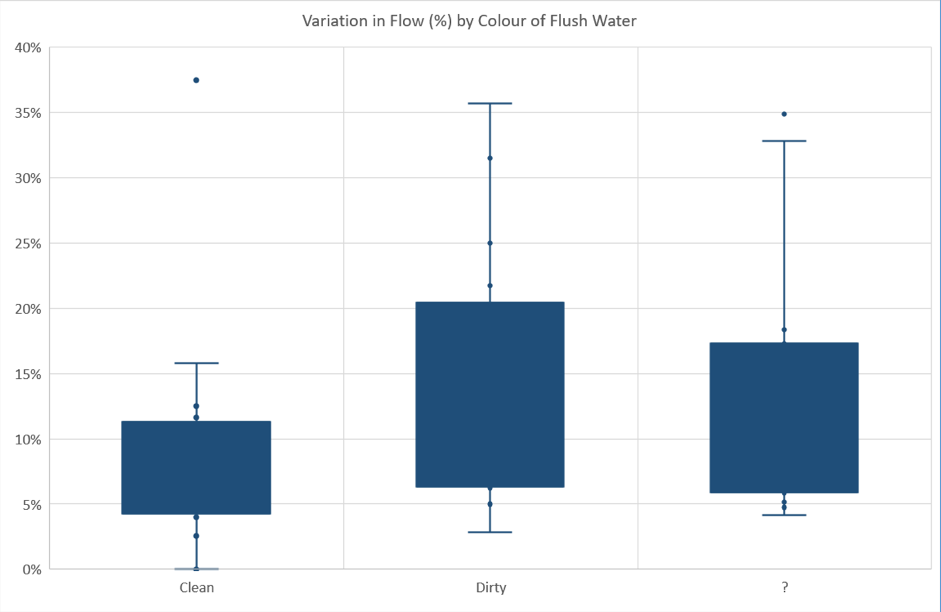 Figure 10 Relationship between variation in flow and colour of flush water
The data (Figure 10) suggests that there is a relationship between the colour of the flush water and performance of the system. Sites where the flush water at the time of the evaluation was clean (either completely clear or only slightly discoloured) showed generally lower values for variation in flow than sites where the water was categorised as dirty. There is one outlier in the “clean” data set with very high variation, which may reflect residual blockage from historical accumulate of debris in the system. Data displayed as “?” is those sites where the colour of flush water was not recorded.
Conclusions and Recommendations
The data collected and the comparisons made in the graphs indicate that the two most important management factors for good drip system performance are the age of the dripline, and the frequency of flushing.
In both cases there is a wide range in performance at a given dripline age (Figure 1) or flushing frequency (Figure 2), but there is also a clear trend towards better performance by systems with younger dripline, and by systems which are flushed more often. The relationship between variation in flow and the colour of flush water (Figure 10) further supports the importance of flushing.
The data does not support a blanket recommendation on the critical age at which systems should be replaced, or the ideal frequency for flushing systems. These will depend on the dripline product used, the makeup of the water being applied, and the maintenance carried out during the life of the system.
It is recommended, however, that regular system performance assessments should be carried out, and the results used to monitor for declining performance of valve units which may point to the need for replacement of the dripline.
It is also recommended that drip irrigation systems should be flushed frequently, as insurance against gradual build-up of debris in the system. In time this material will lead to blockages, requiring replacement of the dripline earlier than would perhaps have been necessary if the system were kept cleaner through more frequent flushing. There is evidence that many sites evaluated in this audit were not flushed frequently enough.
Further investigation into the impact of flushing manifolds on the effectiveness of flushing is recommended. There is evidence in the data collected to suggest that flushing effectiveness of systems without manifolds is superior, as they perform at a similar level to manifold systems, but with far less frequent flushing.