Results of System Performance Audit
Irrigation Performance Audit
Drip irrigation system performance audits were carried out on 50 irrigation valve units across the Australian almond industry. The regions covered and the number of valve units evaluated in each region are shown in Table 1.
Note that the reason only two evaluations were undertaken in the Northern Adelaide Plains is that only two drip irrigated almond orchards could be found in this region. Only five evaluations were undertaken in the Riverina due to the difficulty of accessing that district from the Riverland and Sunraysia, where the project staff were based.
Table 1 Drip irrigation system audits conducted across the regions of the Australian almond industry| Region | Number of Valve Units Evaluated |
|---|---|
| Northern Adelaide Pains | 2 |
| Riverland | 21 |
| Sunraysia | 22 |
| Riverina | 5 |
The audit generated a set of data for each valve unit across the various performance indicators. This data is presented below, with each valve unit evaluated represented by a single bar in the graph, and the performance of each valve unit ranked from worst (left hand end) to best (right hand end) for each indicator.
Performance Audit Results
Variation in Pressure
This indicator compares the highest and lowest pressures measured across the valve unit, and expresses the difference as percentage above and below the midpoint (average of the highest and lowest pressures). The target is less than ±10% variation from the midpoint between the highest and lowest pressures (for example for a midpoint of 100 kPa, the highest pressure should be e <110 kPa, and the lowest >90 kPa), and is shown as an orange line across the graph.
 Figure 1 Ranked performance against variation in pressure (orange bars are non-pressure compensating systems)
It is apparent from Figure 1 that a large proportion of the sites measured showed pressure variation well outside the target of ±10%. However, it is important to note that pressure variation within a pressure compensating dripper system (blue bars) does not directly influence flow variation, as pressure compensating drippers are designed to emit the same flow rate across a large range of pressures.
As a result, this indicator is only relevant to non-pressure compensating systems (orange bars). Looking at just these sites indicates that most of the non-pressure compensating systems assessed performed poorly, with variation in pressure greater than ±10%, and up towards ±30%. This can be expected to result in unacceptably large variation in flow (>±5%).
Variation in Flow
This indicator compares the highest and lowest emitter flow rates measured across the valve unit, and expresses the difference as percentage above and below the midpoint (average of the highest and lowest flows). The target is less than ±5% variation from the midpoint between the highest and lowest flows (for example for a midpoint of 2 L/h, the highest pressure should be <2.1 L/h, and the lowest >1.9 L/h).
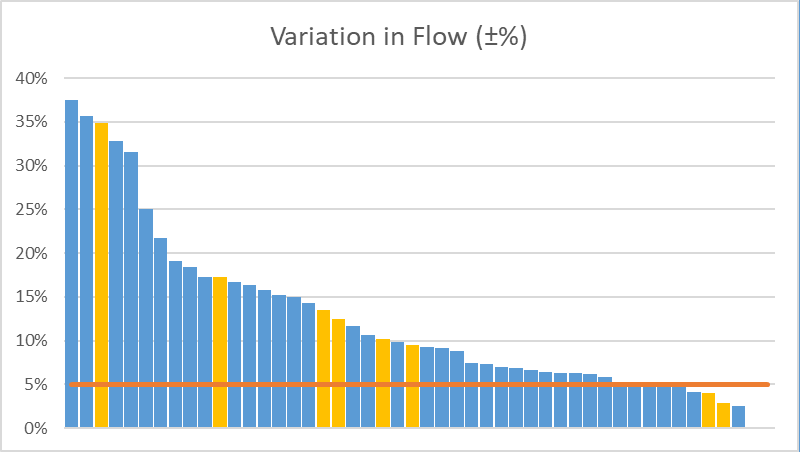 Figure 2 Ranked performance against variation in dripper flow (orange bars are non-pressure compensating systems)
Again Figure 2 shows a wide range of performance, and a large proportion of sites which exceed the target and are therefore performing poorly.
Performance amongst the non-pressure compensating systems (orange bars) reflects the level of variation in pressure (Figure 1), and reinforces the importance of good design for non-pressure compensating irrigation systems.
In the pressure compensating systems (blue bars), pressure variation cannot be blamed for the many poorly performing valve units, and other reasons must be sought. The most likely culprit is partial blockage of some drippers due to accumulation of foreign material in the laterals, most commonly found at the ends of laterals. This may lead to low flow rate of the affected drippers, but can also result in increased flow rate by impeding the proper operation of the pressure compensating diaphragm.
Another potential cause of increased flow rate is wear of the emitter labyrinth due to age and/or the passage of abrasive materials through the emitter. The design of drip emitters relies on the turbulent flow path to reduce flow rate relative to a lamina flow path, giving a reduced flow rate with larger passages, reducing the blockage potential. However, wear of the labyrinth reduces the turbulence of the flow, and allows greater flow rate, causing flow rate to increase and become more variable as systems age.
Flow Variation from Design
This compares the average emitter flow rate to the manufacturer’s design/nominal flow rate for the dripline being used. For pressure compensating emitters the flow rate should be constant across the valve unit despite variations in pressure, and should be close to the quoted nominal flow rate for the dripline product being used. The target is less than ±5% variation from the design flow rate (for example if the design flow rate is 2 L/h, the average should be between 1.9 and 2.1 L/h).
 Figure 3 Ranked performance against variation from nominal dripper flow (orange bars are non-pressure compensating systems)
The interpretation of the data differs depending on whether the system is pressure compensating or not. For a non-pressure compensating system (orange bars) any design flow rate that is quoted is based on a reference pressure, and average flow rate across the valve unit is expected to vary as average pressure is varied up or down. As a result this indicator is not particularly useful for non-pressure compensating systems, unless the full dripper specifications are used to estimate the design flow rate at the average measured pressure, data which was not collected in this exercise. Note that the greatest variation below nominal flow rate reading in Figure 3 is from a non-pressure compensating system, suggesting that this valve unit is operating at well below the recommended pressure. This is not a problem per se, as long as the irrigator is aware of the actual flow rate when scheduling irrigations.
For pressure compensating systems (blue bars), however, the drippers are designed to provide the design flow rate across a wide range of pressures, and therefore significant variation of the average flow rate from the design flow rate is a major issue. Just one very relevant issue is knowing the amount of water applied by the system. In times of high water prices and reduced allocations in many jurisdictions, this is a major problem for scheduling irrigations and managing water resources within the context of a horticultural business.
There is a small but significant group of pressure-compensating valve units in Figure 3 which demonstrate high average flow rate relative to the nominal flow rate of the product being used, and a smaller group of valve units with low average flow rate. Partial blockage or aging systems may be the cause of these variations in pressure compensating systems.
Coefficient of Uniformity
Coefficient of uniformity compares the variation across all flow rate measurements taken from a valve unit, and expresses the result as the average closeness of measurements to the average measurement (100% indicates all measurements are exactly the same). The target is greater than 90% CU.
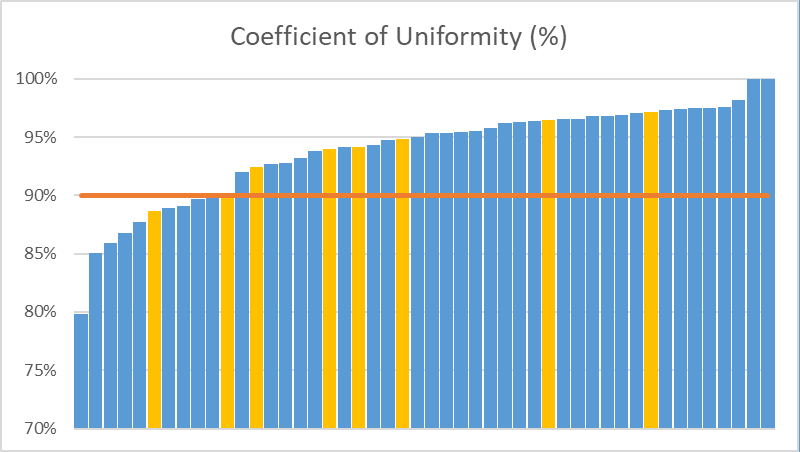 Figure 4 Ranked performance against coefficient of uniformity for dripper flow (orange bars are non-pressure compensating systems)
It is interesting that the majority of valve units tested performed better than the target for this indicator (Figure 4), even though many performed poorly for Variation in Flow. This may be explained by considering what each of these indicators measures. Variation in Flow measures the separation of the highest and lowest measurements from the mid-point, and is therefore highly impacted by the most extreme individual readings. Coefficient of Uniformity is based on the average difference of all the flow rate measurements from the average measurement, and thus a single extreme value has less influence on the overall result.
This distinction, and the poor performance of sites against Variation in Flow compared to Coefficient of Uniformity, suggests that many of the valve units measured had one or two drippers giving especially high or low readings, whilst the remainder of the drippers measured were performing close to the average.
This pattern of performance suggests that the problem at many of the sites assessed is one or two dripper outlets with partial blockage of the dripper outlet, leading to either excessively high or low flow rates. As mentioned above, partial blockage may reduce the flow rate through restriction of the internal passages in the dripper, but may also increase flow rate by holding the pressure compensating diaphragm open, preventing it from restricting the size of the internal passages as the pressure increases, as it is designed to do.
The theory that partial blockages are responsible for variation in flow rate is supported by the fact that some of the measurements at every site were taken from the outer edges of the valve units, the places where debris is most likely to collect, thus increasing the likelihood of blockages occurring.
Lateral Flow Variation from Design
This final indicator compares the flow rate of a complete lateral with the flow rate expected based on the number of drip emitters along the length of the lateral. This will potentially identify the presence of partially or fully blocked drippers or worn drippers, which may not be identified during the specific pressure and flow rate measurements above. The target is less than ±5% variation from the design flow rate (for example if the design dripper flow rate is 2 L/h, dripper spacing is 0.5 m, length is 100m, the expected flow rate is thus 400 L/h, measured flow rate should be between 380 and 420 L/h).
Note that not all valve units evaluated had this measurement taken, so the data set is slightly smaller. In some cases it was too difficult to collect this measurement due to the set-up of the system (for example subsurface systems with flushing manifolds, requiring extensive digging).
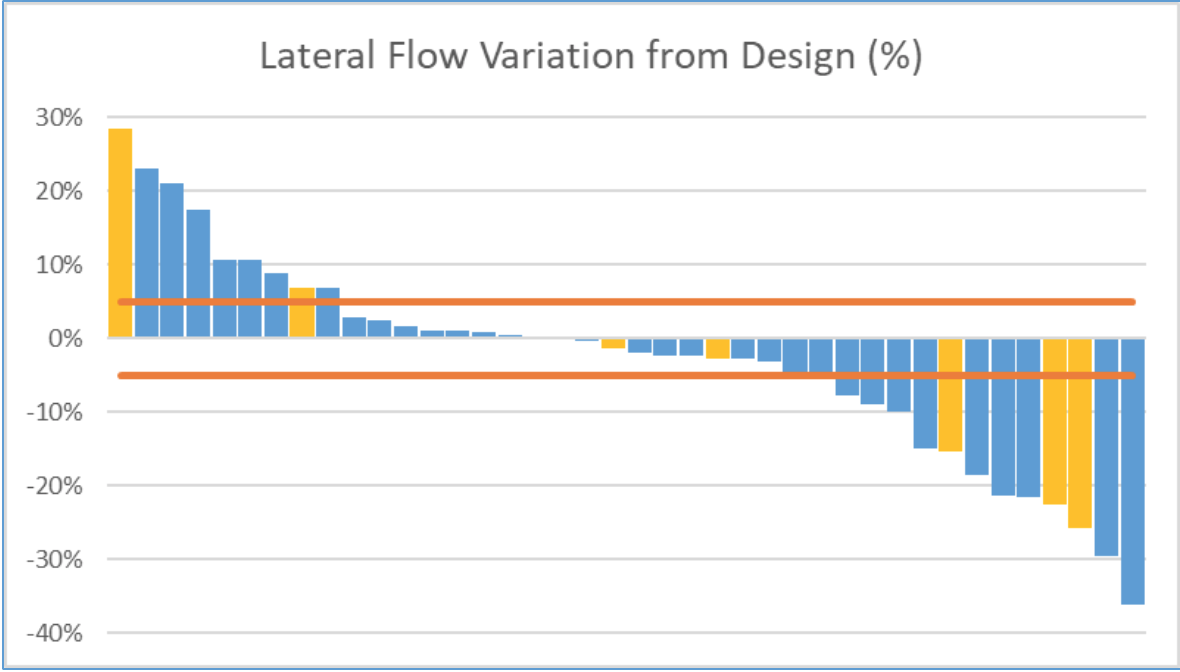 Figure 5 Ranked performance against variation in flow rate for an entire dripline lateral from design flow rate (orange bars are non-pressure compensating systems)
Again the results must be interpreted according to the type of drip emitters used. The valve unit showing the highest increase in lateral flow rate over nominal in Figure 5 is a non-pressure compensating system (orange bars), which reinforces the result shown in Figure 3 for average flow rate compared to nominal flow rate.
Results for pressure compensating dripline (blue bars) indicate a few sites with higher flow rate than expected, and another group with lower than expected flow rate. Interestingly, the number of sites with low flow rate, and the magnitude of the decrease in flow rate is more extreme for this indicator than for variation from nominal flow rate for individual drippers (Figure 3)..
The reason for measuring a full lateral was as a cross check on the individual measurements made at a few (9 to 12) locations across the valve unit (the basis for the data in all previous figures). Measuring a full lateral ensures that the flow rate of every drip emitter along the lateral contributes to the measurement, rather than only two or three randomly selected emitters in that lateral.
The comparison of Figure 3 with Figure 5 indicates that this additional measurement has been worthwhile, as it has identified that there are some valve units where the individual drip emitter measurements indicate acceptable or close to acceptable performance, but the full lateral measurement indicates a much greater reduction in flow rate. This suggests the presence of partially or fully blocked emitters along the length of the lateral, which were not identified during the individual measurements.
Other Observations
Observations of the general condition of the system were taken during the evaluation. Seven sites had obvious leaks across the valve unit, whilst at another four sites there were noticeable blockages, and some parts of the dripline were buried at three sites (in addition to the five sites with subsurface dripline). There was evidence of algal growth in the dripline at five sites. However, at 31 sites there were no obvious problems visible.
As part of the evaluation at most valve units, a lateral was flushed or the flushing submain opened to assess the colour of the water which came out. Roughly 2/3 of the sites evaluated had dirty to very dirty flush water, indicating the presence of accumulated material at the time of the evaluation.
Bearing in mind that some property owners flushed a few days before the evaluation was conducted because they knew the system was being evaluated, this number of sites with dirty flush water is of concern, and suggests that the general frequency of flushing across the almond industry may be inadequate to maintain clean driplines. Dirty driplines will lead to blockage of drip emitters, and once emitters are fully blocked it is extremely difficult to unblock them, generally requiring complete replacement of the dripline.
As part of the questionnaire, the property owner/manager was asked to provide information about the system, including the design operating pressure. Of the 50 valve units evaluated, 17 were unable to provide a design pressure. Any professionally prepared irrigation system design should be based around a minimum operating pressure (usually expressed as pressure at the valve), and should always be operated above this pressure to ensure sufficient pressure at all emitters across the system. The lack of knowledge of this minimum pressure by so many irrigators is of concern.
Conclusions and Recommendations
Performance of valve units tested during this project was variable, depending of the performance indicator used.
Variation in flow rate (Figure 2) was excessive in roughly 80% of valve units tested, indicating the presence of one or two very high or very low flow rates amongst the drip emitters measured. In the case of the non-pressure compensating systems this appears to be directly related to the variation in pressure across the valve units. However, in the pressure compensating systems this should not be a problem, and the flow rate differences must reflect another cause, likely partial blockage of drip emitters.
Assessment of performance against coefficient of uniformity (Figure 4) on the other hand, indicates that only 20% of valve units tested performed poorly. This suggests that at many sites there were one or two high or low flow emitters, but the bulk of the emitters performed very similarly. This would agree with the explanation above, where partial blockages are occurring in a few emitters but the majority of emitters are clean and performing as designed.
Comparison of test lateral flow rate with design flow rate (Figure 5) further supports this conclusion, with roughly 40% of tested laterals varying from the design flow rate by more than 5% above or below.
This conclusion is further supported by the results of observations of flush water during the evaluations, with roughly 67% of sites having dirty flush water, indicating the presence of foreign material in the laterals, often at very high levels.
It is recommended that more frequent flushing of dripper laterals, as well as mainlines and submains, is promoted across the almond industry as a simple method of insurance against the development of blockages, leading to poor water distribution and consequently poor productivity.
Best Practice
Management
More in-depth evaluation of the evaluation results, and comparison with some potential critical factors is presented here.